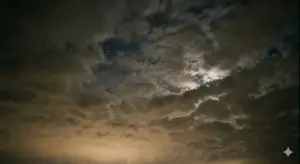
 The simple answer is: you cannot!
Yes, this is the most frustrating part of the hobby, especially when the small fortune is rotting in your shed or backyard, the sky is covered with clouds for weeks or months, and you do not even have time to do the regular polar alignment after the recent changes you made to your rig. Your thoughts are becoming less and less pleasant, and you start wondering whether you live in the country relevant to your hobby! Or maybe it is time to sell the rig and start diving or… playing checkers.
Indeed, there are not many things that can cripple your attitude and lead to depression like the inability to do what you know you have to do, but you can’t, and you have no influence on the reasons whatsoever, yet what you can do is to face the problem from a scientific perspective. If you cannot defeat the enemy, try to know it better. In other words, I will talk about the measurements and how to approach the problem.
Theory
In theory, measuring the cloud cover is, in fact, the measurement of the temperature at the bottom of the cloud cover. The result is called a sky temperature. Sky temperature (or “apparent sky temperature”) is measured remotely using infrared radiometers. These sensors do not measure the actual kinetic temperature of the air. Instead, they detect the intensity of longwave (far-infrared) thermal radiation emitted downward by the atmosphere. Even during the day, a cloudless sky measures significantly colder than the surrounding ambient air. It typically ranges from -5 °C to -50 °C because you are essentially measuring the temperature of the upper atmosphere and outer space. So far, so good, but this would be an ideal model, and such models exist only in a perfect life. In real life, we have to deal with ambient temperature, which will always influence the measurement. Regardless, you use the highly precise, research-grade instrument that measures long-wave radiation (those generally feature specialised silicon domes that block shorter-wavelength sunlight so only the sky’s infrared emission is read) or portable or mounted devices that can continuously scan the sky to estimate thermal radiation you always have to remember that the sensor body itself radiates heat, its own temperature must be carefully monitored and considered during the calculations of the sky temperature.
Practical application
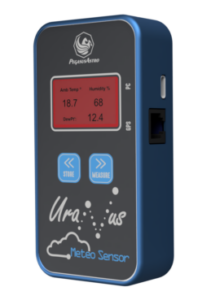
There are many popular devices that astrophotographers can use. You can find small, portable devices like those shown beside Pegasus Astro Uranus or a slightly larger equivalent, designed to work on premises. In this article, I will focus on the Cloudwatcher solution.
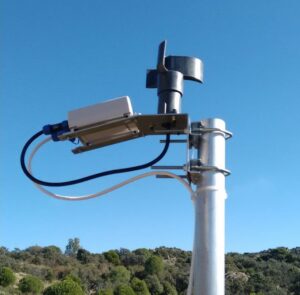
The Lunático AAG CloudWatcher (see the picture below) measures sky temperature using a dual-sensor system consisting of a specialised infrared (IR) sensor and an ambient thermometer. It pairs these physical readings with a custom data-correction algorithm.
In its simplest form, the device identifies the presence of clouds by tracking the temperature difference between the sky and the ambient air:
Tsky=Ts-Ta
Clear Sky
A clear sky transmits heat out into space. The IR sensor sees right through to the cold upper atmosphere, resulting in a very low Ts value. The delta Tsky will be deeply negative (often between -20°C and -60 °C).
 Cloudy Sky
Clouds act as blankets that absorb and re-emit longwave infrared radiation back to the ground. When clouds roll in, the IR sensor detects this heat, and the Ts value rises dramatically. The delta shrinks, moving closer to 0 °C or even going positive.
Again, the results of these calculations stand well in a theoretical environment. In real life, we are dealing with the direct sunlight, rain, humidity and other factors that can make these readings inaccurate, especially when we consider seasonal changes throughout the year.
Here comes the solution introduced by Lunatico – the K factors.
Ambient weather conditions and atmospheric humidity shift throughout the year. Because of this, a basic subtraction model creates false cloud alarms during the yearly seasonal change. To fix this, Lunático builds advanced variables called K-factors and implemented it into their software.
The software uses an expanded, proprietary mathematical formula where these K-factors mathematically scale the impact of ambient wind, humidity, and seasonal changes. This mathematical smoothing ensures that a clear sky in peak summer doesn’t register as a cloudy sky in dead winter. Because the correct settings for each factor can be a tricky and time-consuming task, Lunatico provided a model that helps to adjust the K-factors to your local environment.
This K-Factor Optimiser is available for all customers. The principle is simple: enter your local circumstances and click calculate. This software will calculate the K factors for you, and you can manually adjust each factor and see how this influences the readings through the sky and ambient temperatures. When you are satisfied with the results, you just type in the calculated K-factors into your software and enjoy the new readings.
Cloud cover
Now that you have the sky temperature and your readings seem to be accurate throughout the whole year, it’s time to calculate the cloud cover in percentage. The Cloudwatcher software shows the cloud coverage using the three states.
- Clear: The temperature delta is wide enough to safely uncover the equipment.
- Cloudy: The delta shrinks, triggering alerts or pause commands in astrophotography software.
- Overcast: The delta disappears, automatically triggering a built-in safety relay to physically close the observatory roof or raise an alarm to cover the telescope before rain can arrive.
Yet, it is quite easy to transform your readings into an understandable value that shows the current coverage in percentage. You can convert a single-point sky temperature reading into a cloud cover percentage using a linear interpolation formula bounded by your location’s local weather extremes. First, you have to establish your clear and overcast baselines. You have to identify two temperature limits Tclear (the expected delta on a perfectly crisp, cloudless night, which would be your coldest possible value) and Tovercast (the expected delta when the sky is entirely blocked by thick, low clouds, which would be your warmest possible value, where the sky temperature matches or closely approaches ambient temperature).
Now you have three values: your current delta Tcurrent, Tclear and Tovercast, so the formula to calculate the percentage is:
CloudCover[%] = [(Tcurrent - Tclear)/(Tovercast - Tclear)]*100
Of course, if you plan to use these values for the presentation or store them in the database, you have to adjust the formula to prevent values from going beyond 100% or below 0% (what may happen if the night is ‘more clear’ than you expected), but this technical problem is very easy to prevent using the conditionals.
Please bear in mind that I am not advertising any products or solutions. I just showed them as an example of where to get the data from. Also, this article does not cover all the functionality of the presented devices. Also, please let me know if you have any questions or suggestions.
More Stories
M39 star cluster
Sh2-129 Squid Nebula
NINA Flat Wizard drops frames